I’ve created our own badge integration with Credly and I want to track total customer badges earned across the platform on a group dashboard for leadership. This means I have to capture data for each assessment tied ot the badge trigger and filter out internal employees.
I’m using tagging to accomplish this using the following parameters:
1. There are 2 ways to earn every badge: By either passing the pre or post test. However, some people are choosing to take both and passing both and I don't want to count individuals twice. So I need a way to count by the badge earned. My solution was to tag the assessments by the badge name and use a distinct count per tag, but I'm open to other methods and suggestions.
2. Badging is an integration and is triggered upon passing the above assessments, so it's not registered in TI. I can only use assessment passed to determine badges awarded.
Filters:
- Email (does not contain) {employee email domain}
- Assessments Passed = yes,
- Content Tags Tag (is) {designated badge tag}
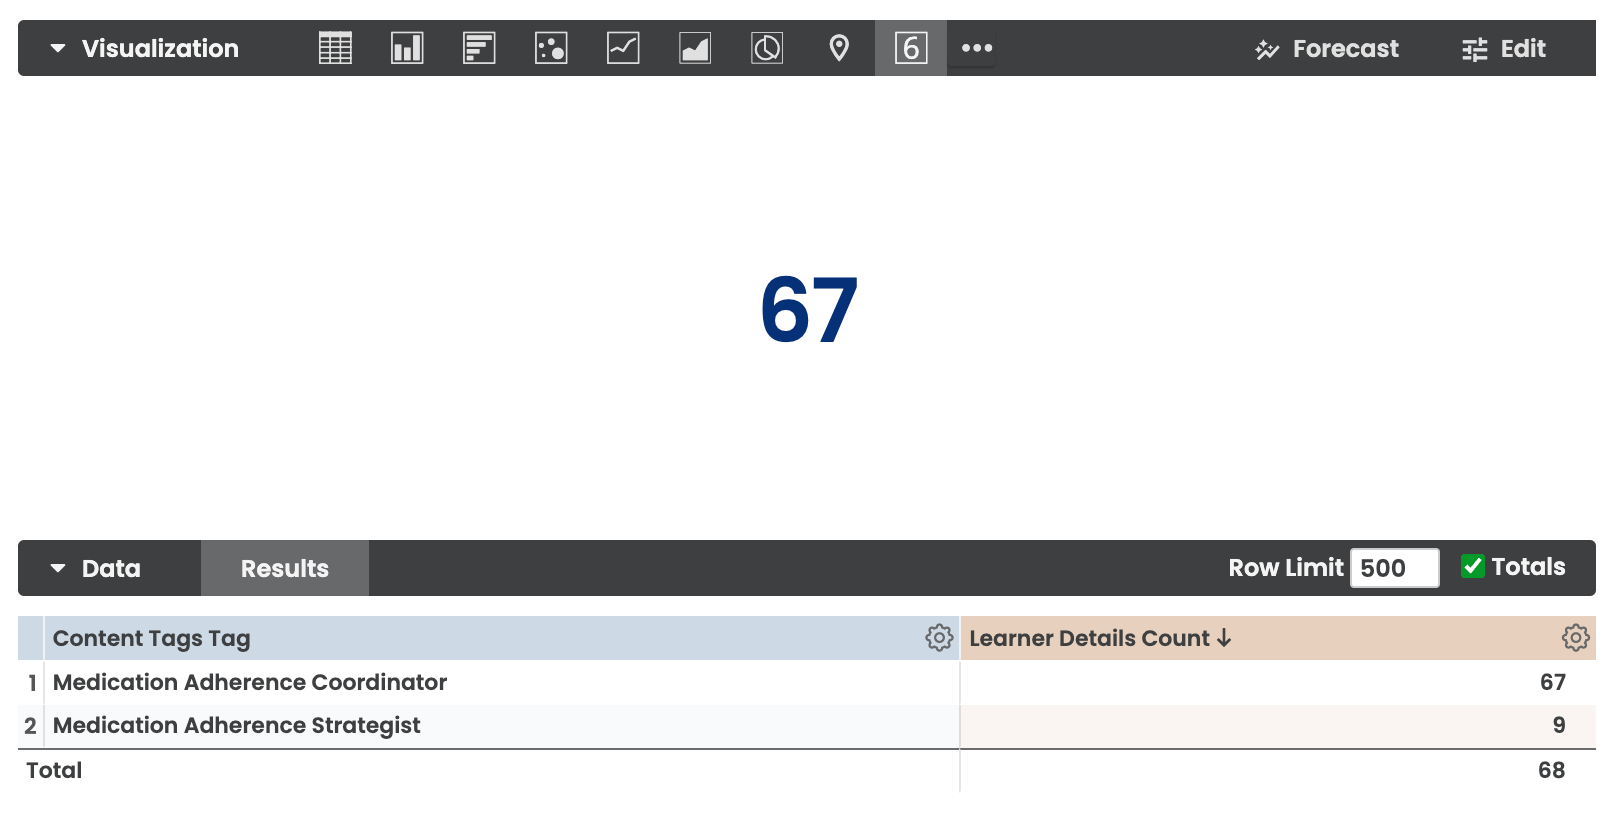
Data: {Content Tags Tag} BY {learner detail count]
THE PROBLEM: It will not provide a sum total of learners by badge tag. It takes the total number of learners for the first tag and stops there? I’ve tried using separate filtered group for each tag using the OR operator and get an even weirder outcome. It’s not configurable in the Visualization section either. I’m at a loss here. I’ve added a screenshot below. I’ve tried to solve this with a filtered measure, but the query doesn’t acknowledge sum, distinct_count, or total? Can anyone help. TI’s reporting documentation is very basic and not helpful. Would love to see an office hours or webinar on this.