Has anyone found a reliable way to track Daily Active Users/Monthly Active users across multiple Panoramas?
At the individual Panorama level TI has the “Learner Usage” report which shows visits across time, but these need to be exported from each Panorama. At the main site level there is “Logins” which is part of the Reporting Hub Library, however, this report will not track users who access via SSO (it appears to only track username and password logins).
Unfortunately, my organization is split between 50% of our clients using a password login method and 50% under SSO.
If anyone has suggestions of where to start it would be appreciated!
Best answer by Christopher.Hernley
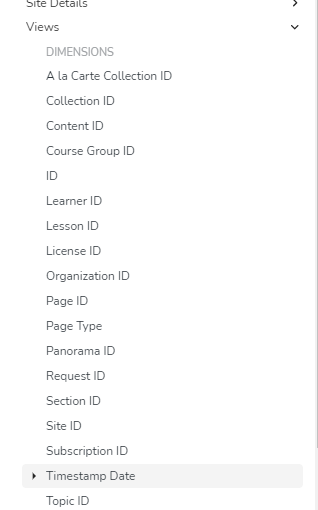
Hi wwayson - After lots of back and forth with TI they pointed me to Reporting Hub > Explore > Start Building > Who are my learners? and from there make a custom report that includes the “timestamp date” from “Views”
This was something that they added back in the summer of 2022 and was buried in a product release announcement as a “fix” for the last active date. As far as we can tell the info is accurate.
For what it is worth my company does not find much value in the prebuilt reports from your screenshot. TI wont let us drill into them to see what / how they are built and from what tables the data comes from to validate that the info is correct.
7 replies
A
Anonymous
March 6, 2023
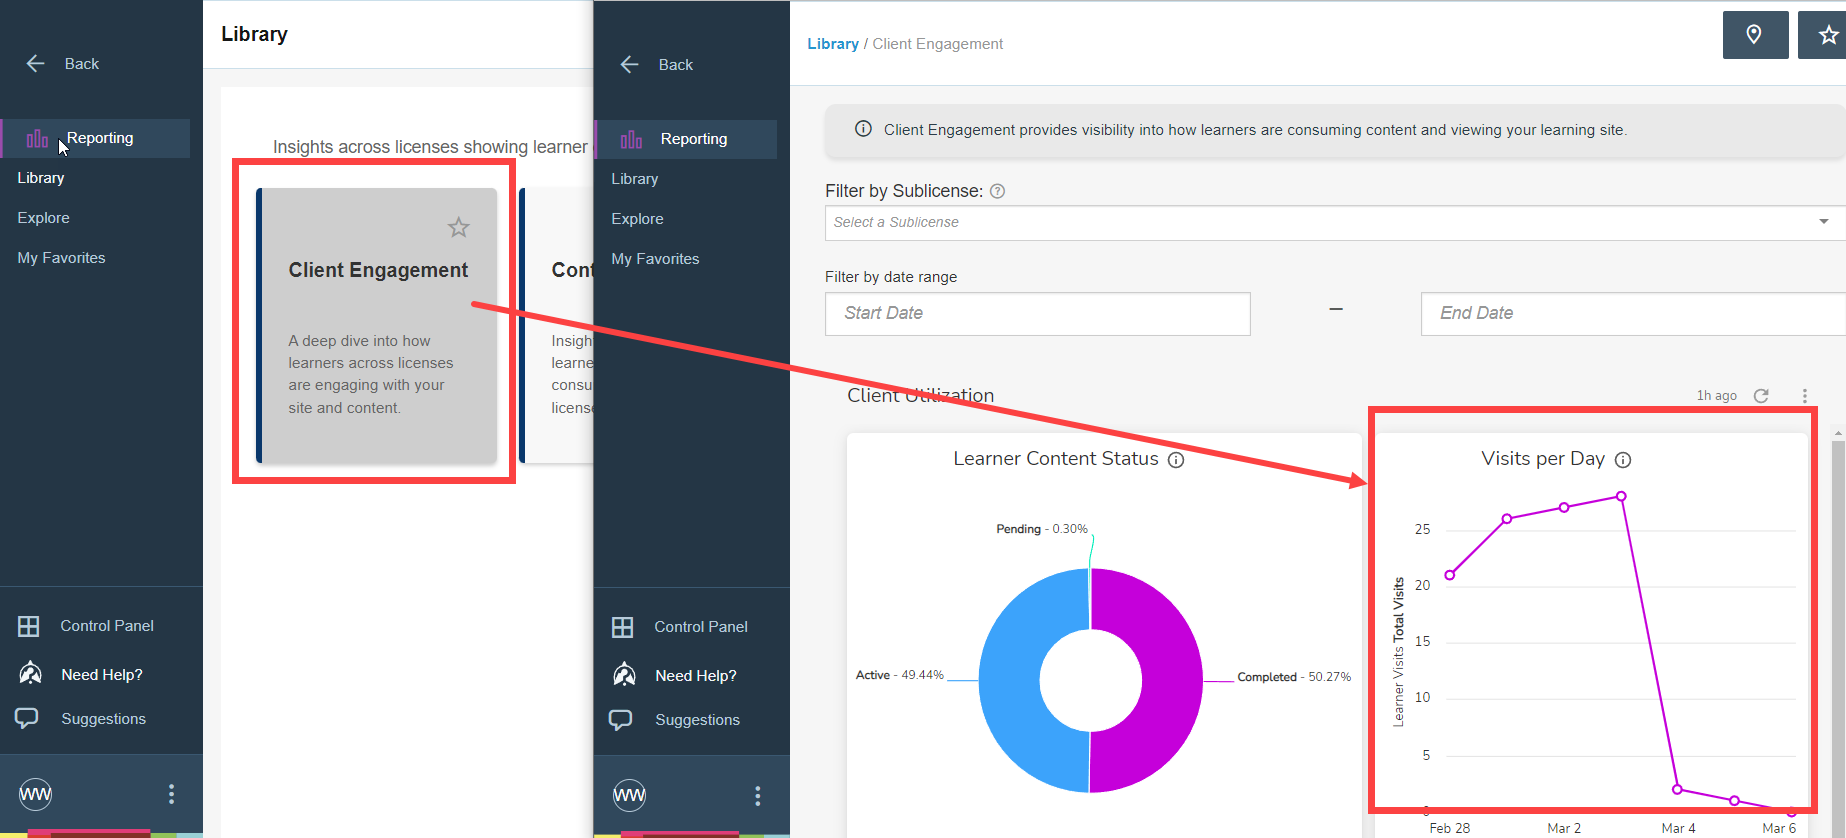
I would also appreciate any input or suggestions. Ti provides a Panorama Library with a Visits per Day report chart. I am attempting to replicate, but cannot find or figure out the correct data fields. The provided chart does not have accurate numbers or options we need.
Hi wwayson - After lots of back and forth with TI they pointed me to Reporting Hub > Explore > Start Building > Who are my learners? and from there make a custom report that includes the “timestamp date” from “Views”
This was something that they added back in the summer of 2022 and was buried in a product release announcement as a “fix” for the last active date. As far as we can tell the info is accurate.
For what it is worth my company does not find much value in the prebuilt reports from your screenshot. TI wont let us drill into them to see what / how they are built and from what tables the data comes from to validate that the info is correct.
A
Anonymous
March 7, 2023
Hi Christopher,
Thank you for the information. I spent most of the day yesterday working on reports and discovered the Timestamp Date. Were you able to create a line chart (like the ‘logins over time’ showing a history?
I agree with everything you stated, including not finding much value in pre-built reports. I would prefer drill down but could get around it if I could create a dashboard with consistent data.
I’ve had the same back and forth experience. Although I regret to hear you have this experience, it gives me a bit of comfort knowing I am not the only one struggling with reporting.
Feel free to reach out, I’d be glad to compare notes. My email is wayne.wayson@quantivate.com.
Hi Wayne - Glad to hear you found the same option! Ultimately we pulled the data out of TI to do the manipulation in external tools. I’m sure the ability to construct the visuals we need is there but its a bit of a learning curve to figure out how to use Looker well, so we opted for the tools.
I used the timestamp trick to try to get an idea of monthly active users in my academy-- thanks for sharing! Wondering if you’ve come across a better way to track this in TI and have a line chart showing logins over time since you initially had this conversation?
@saravitale Sorry for the late reply - no, we’ve continued to use an external visualization tool for the data. Looker can probably do this, but we’ve found the interface a little confusing vs an external tool like Power BI. Your CSM or support might be able to help out?