I’d like to report on my MAUs (both seeing the number for the current month and as a time series month by month). The pre-built report by Ti doesn’t work for us because it doesn’t allow us to filter out internal email addresses.
I have tried using Learner Engagement by Date and Views Timestamp Month to recreate the Ti-built chart and then to filter out the internal emails, but the results are always slightly off.
All of my users are in one panorama.
Page 1 / 1
Hi @Eniko Farkas
Absolutely, this is an important reporting question. It’s a challenging one to address for collectively for customers because active can be defined so differently. It’s also challenging to build the right report because active definition changes depending on the data table you are using vs what data you need to surface. Here are some suggestions on value reports we have built to help customers answer this question.
Report of Tracking Learner Activity Over Time
Course Total Time Tests / Time per page dashboard
Loom video - Course View Time Trend Report Overview
Base reports / Learner Content & Progress (Site) - added or removed from the data table
Recommendation for learning: pivoting data using the Max answer (field) as the pivot point
You may still want some validation on the specific report you are trying to achieve. For that, please register for Open Sessions here and Pre-submit your Question HERE to ensure we can prioritize your time and be prepared to assist live on the call.
You can also email success@thoughtindustries.com - we can help you with guidance or strategy if you get stuck and the other avenues don’t meet your needs.
Many thanks! Jeanne from Scaled Success Team
Hi @jeannehurtz , thanks a lot! These are great resources.
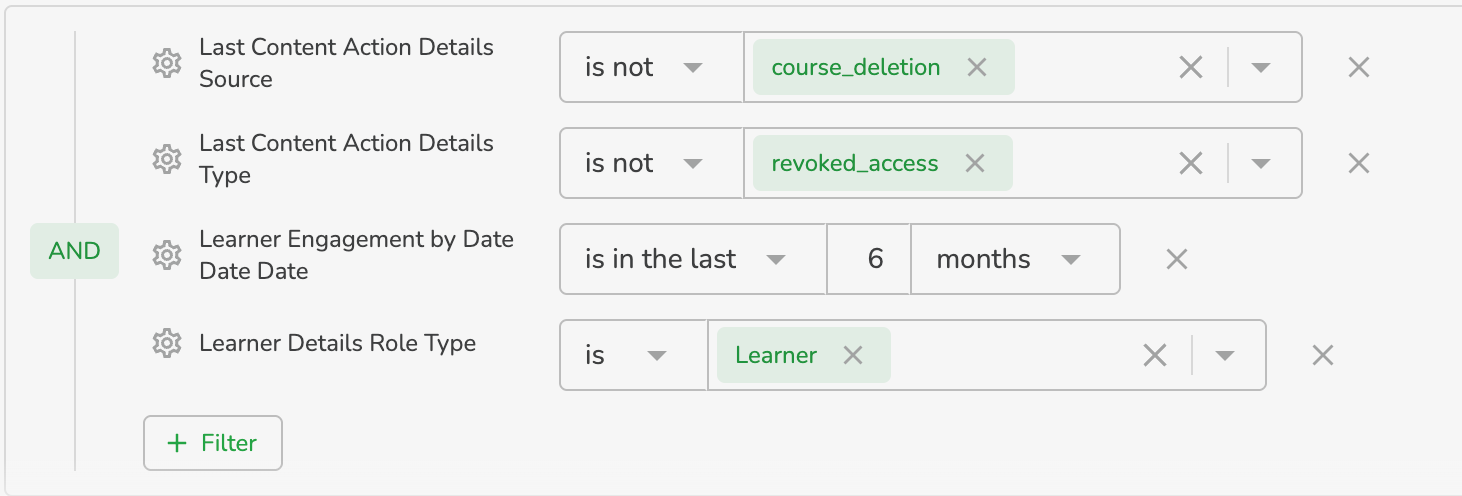
I like the definition you have in the Executive Summary: Users who have enrolled, started, viewed or completed content within the Date filter
Can you show me the filters behind this?
Sure thing @Eniko Farkas -
Here’s a screenshot of the filters on the Monthly Active Users tile: