
Summary:
Do you find that many of your users who start taking content drop off mid way through the course? Would it help to know who these users are so you can reach out to them, and also identify trends on particular content items that have high drop off rates? If so, this report is for you. Read on!
Requirement Overview:
If any of these requirements fit your end goal, this may be the play for you.
- Requirement 1: List all users who are in the middle of taking a course
- Requirement 2: List all users who have been registered for more than 3 months
- Requirement 3: List all users who have not viewed content in more than 3 months
- Requirement 4: List allusers have viewed content more than once but less than 10 times
Functional area to be used:
- Reporting > Create
Core Functionality Configurations:
Description :
Use any Explore in the Learner section of the Create page, then choose to display all users who have not viewed content in the last three months and have a content status of Started.
Configuration:
- Navigate to the Reporting > Create page (/learn/manager/reporting-hub/custom-reports).
- Choose the Who are my Learners? report under the Learner section.
- Choose fields to display and filter (add other filters if required).
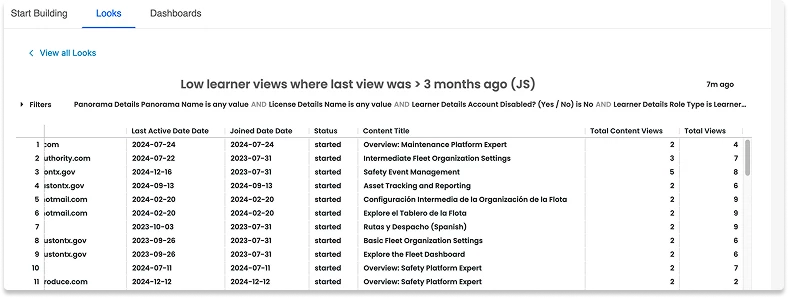
- In the screenshot, we selected Email, Content ID, Content Title, Content Status, Date Joined, Last Active date. Total Content Views and Total views. We selected Content Title, Status, Account Disabled (Yes/No), Email, Joined Date, Last Active Date and Total Content Views to filter on.
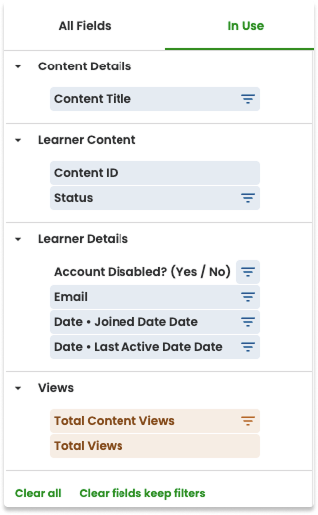
- In the screenshot, we selected Email, Content ID, Content Title, Content Status, Date Joined, Last Active date. Total Content Views and Total views. We selected Content Title, Status, Account Disabled (Yes/No), Email, Joined Date, Last Active Date and Total Content Views to filter on.
- Click the Run button in the top right to create the base report which will now display the filters to be used for the next step..
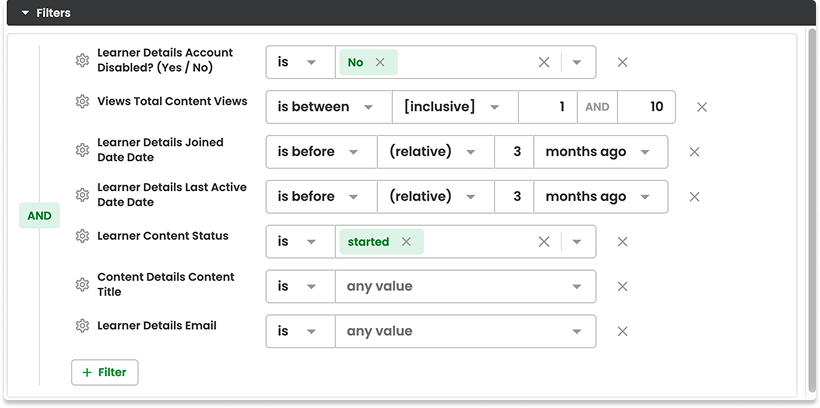
- In the filter options choose the following conditions to identify active learners who joined more than three months ago, are midway through a course, have not viewed the course in more than three months and have viewed the content less than 3 times.
- Click the Run button again to view the data and it looks as expected.
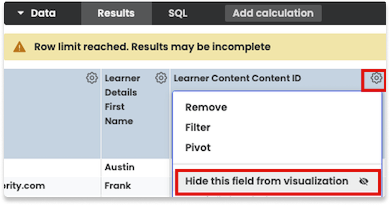
- Go down to the Data section of the report and click the Gear Icon in the Learner Content Content ID field. Then click Hide this field in visualization to hide the field from the report.
Feel free to drag the field headers into the order you require.
- Once you are happy with your graph, click the Gear Icon in the top right corner and choose whether you want to save as a Look or to an existing Dashboard.
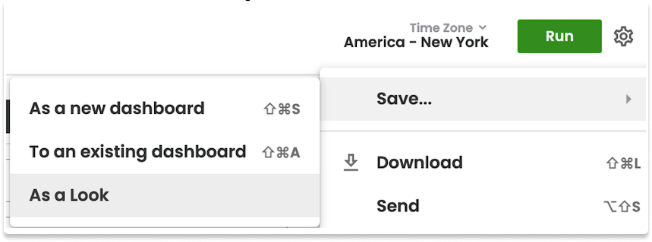
You cannot use the save to new dashboard option at this step if you'd like it to be in the Group folder and therefore, visible to other users. Choose save to an existing dashboard to add it to a dashboard within a Group folder.
Risks and considerations:
- Your report may need to be filtered differently if you only want to see the values per specific content types, (e.g. Certifications).
- If you have too many records you may need to limit the number of countries you report on in order to get a readable display.