Report that shows which questions learners are struggling with
I’m looking for a report that shows the pass/fail percentage of each individual question in an assessment. I don’t particularly care which answer folks are picking, or who is getting it right/ wrong. Just trying to get a grasp of which questions people are struggling with, and which ones might be a bit too easy.
Does anyone know if this is possible/ how it can be done?
Thanks in advance!
Page 1 / 1
I ended up finding the raw data in the Reporting section of the content itself. I was able to clean it up and get some good insights. Now I’m on to the next level of granularity: seeing which answers learners chose. I can see within the “Assessments” tab of Reporting the breakdown of each question-- however, it’s telling me the “Total Responses” is a single-digit number, when I know the number of learners that took the exam was in the triple-digit range. I’m assuming this “Question Analysis” is just pulling from the past 7 days or something by default, but I see no way of changing this range.
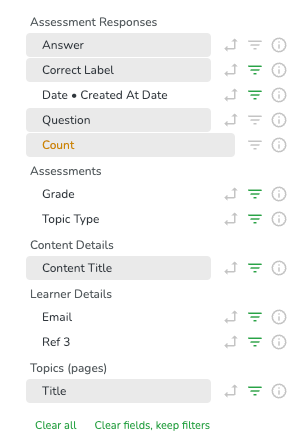
You can create this in the reporting hub as well. These filters let you see the missed questions and which answers were chosen. So, for Question 1, 20 learners chose A.
I hope this helps!
Hi- which report did you use to add your criteria to or did you start from scratch?
Hi @sheavlin !
From the reporting hub, I started with Learner Content & Progress “How are learners performing in assessments” and added the filters you see above.
Hi, thank you. I can’t edit that report. Did you start over copying the fields already in that report?
Please add Competency assessment report to this--- i.e. adaptive learning paths