
Summary:
Do you have the need to review content consumption by your learners per country or region to compare uptake? This is possible using a pivot within a look and changing the view to a bar graph.
Requirement Overview:
If any of these requirements fit your end goal, this may be the play for you.
- Requirement 1: Show the number of content items enrolled in per country.
- Requirement 2: Display the breakdown of content per status.
- Requirement 3: Display the data in an easy to read bar graph.
Functional area to be used:
- Reporting > Create
Core Functionality Configurations:
Description :
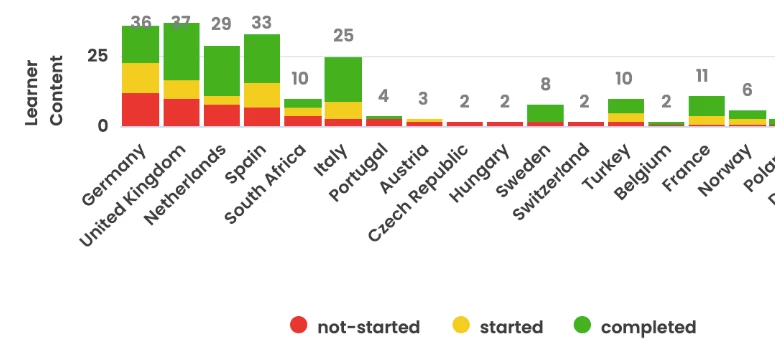
Using any Explore in the Learner Content & Progress section of the Create page, display learner country and status, then pivot on status.
Configuration:
- Navigate to the Reporting > Create page (/learn/manager/reporting-hub/custom-reports).
- Choose the What is the average completion progress on a content item? report under the Learner Content & Progress section.
- Choose fields to display and filter (add other filters if required also).
- In the screenshot, we selected Status, Count, and Country to display. We selected Content Title, Country, and Email to filter.
- In the screenshot, we selected Status, Count, and Country to display. We selected Content Title, Country, and Email to filter.
- Choose the Pivot icon on the Status label.
- Click into the Visualization tab to change from a table format to a bar graph format.
- Enter the settings below to have a RYG, stacked bar graph with a sum of the quantities at the top.
Your graph will now look like this: - If you prefer, you can change from Stacked to Grouped to see the status side by side:
- Once you are happy with your graph click the gear icon in the top right corner and choose whether you want to save as a Look or to an existing or new Dashboard.
You cannot use the save to new dashboard option at this step if you'd like it to be in the Group folder and therefore, visible to other users. Choose save to an existing dashboard to add it to a dashboard within a Group folder.


Risks and considerations:
- Your report may need to be filtered differently if you only want to see the values per specific content types, (e.g. Certifications).
- If you have too many records you may need to limit the number of countries you report on in order to get a readable display.